The performance regression in MySQL 8.0 is well known, but it is still not fully understood. That is because it is not a regression caused by one obvious bottleneck. MySQL 8.0 introduced many new designs and refactored major subsystems, so the gap comes from a combination of configuration defaults, architectural trade-offs, and many small overheads spread across different layers.
So I picked one workload, profiled it carefully, and tried to answer a more practical question: where exactly does the regression come from, and how much does each part contribute?
In this post, I use oltp_update_non_index , one of the worst regression cases between MySQL 5.7.44 and 8.0.45 as a starting point. Beginning from a -32.0% throughput gap, I narrow it to -0.2% by systematically isolating one factor at a time. As expected, the regression is not dominated by a single bottleneck. It is the combined effect of default settings, architectural changes, and dozens of small code-level costs.
1. Setup
Both MySQL versions are compiled with GCC 8.5.0 at -O3. mysqld and sysbench are each pinned to 8 dedicated physical cores with no hyperthreading overlap. The buffer pool is 23 GB. The dataset is a single table with 50 million rows. innodb_flush_log_at_trx_commit=2, sync_binlog=0, and the adaptive hash index is OFF. Both versions use identical InnoDB settings wherever the options are comparable. Full configuration details are listed in the appendix.
The benchmark is sysbench oltp_update_non_index, with 8 threads and 90 seconds per run. This is one of the worst regression cases..
2. Narrowing the gap step by step
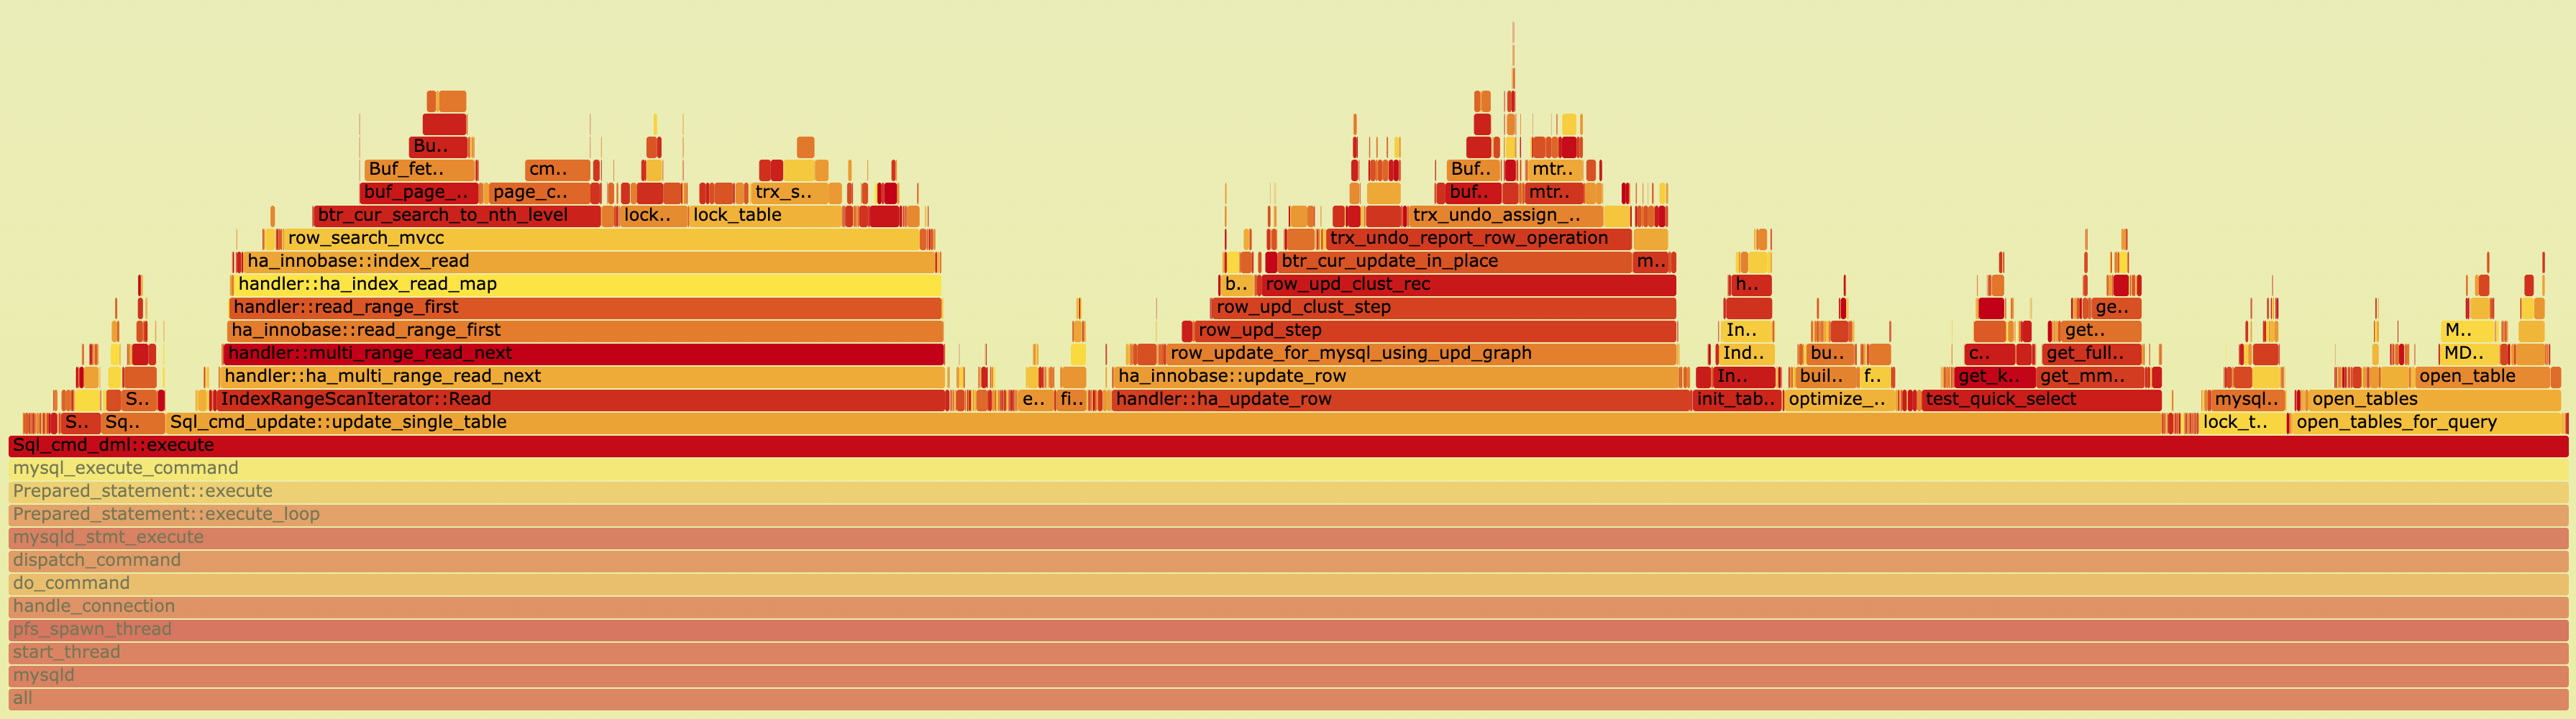
The method is straightforward. I start with MySQL 8.0.45 and 5.7.44 under the same default-like configuration, then use perf record and perf report to see where CPU time goes. Once a subsystem becomes the dominant bottleneck, I either adjust the configuration to remove that cost or write a small targeted patch. Then I profile again and repeat.
Each round removes one visible layer of overhead and exposes the next one underneath.
Starting from the baseline and applying changes one by one, I was able to close almost the entire gap:
| Step | Description | 5.7 TPS | 8.0 TPS | Gap |
|---|---|---|---|---|
| Baseline (PFS=1, bin=ON, writer=ON) | 69,818 | 47,509 | -32.0% | |
| 1 | innodb_log_writer_threads=OFF | (69,818) | 52,539 | -24.7% |
| 2 | performance_schema=0 | 72,316 | 54,919 | -24.1% |
| 3 | skip-log-bin | 128,140 | 109,044 | -14.9% |
| 4 | –db-ps-mode=auto | 135,664 | 125,119 | -7.8% |
| 5 | innodb_flush_log_at_trx_commit=0 | 149,577 | 144,941 | -3.1% |
| 6 | 5 code patches | (149,577) | 149,273 | -0.2% |
From -32.0% to -0.2%. Below is the breakdown.
Step 1: innodb_log_writer_threads=OFF
This is an 8.0-only setting; it does not exist in 5.7.
With innodb_log_writer_threads=ON, a dedicated log writer thread is responsible for writing the log buffer to disk. The problem appears when mysqld is pinned to 8 cores and all 8 are already saturated by client threads. In that case, the log writer thread cannot get scheduled quickly enough. Client threads call log_write_up_to() and spin in ut_delay() while waiting for the writer to advance the write position, but the writer itself is CPU-starved. That creates a feedback loop: client threads spin longer, occupy more CPU, and make it even harder for the writer to run.
With innodb_log_writer_threads=OFF, no separate writer thread is needed, the calling thread takes over the writer role inside log_write_up_to, eliminating the scheduling dependency.
Step 2: performance_schema=0
Disabling Performance Schema reduces the gap further. MySQL 8.0 changed PFS significantly compared with 5.7, including v2 metadata lock instrumentation, new memory statistics layers, and allocator hook changes. However, I did not isolate the PFS internals deeply enough in this workload to say which part is the main contributor.
So for this step, I can say that PFS matters, but I cannot yet attribute the overhead to a specific internal component.
Step 3: skip-log-bin
This is the single largest step in absolute TPS gain. Both versions improve dramatically when binary logging is disabled (5.7: +67%, 8.0: +86%). The workload is commit-bound, and every transaction generates one binlog event. Even with sync_binlog=0, the binlog still adds per-commit CPU cost for event formatting, Table_map construction, and memory allocation.
MySQL 8.0 benefits more from disabling binlog than 5.7 does (+86% vs +67%), which suggests that the 8.0 binlog path adds extra per-event overhead. Looking at the code, I found several 8.0-only additions that are plausible contributors:
ColumnFilterOutboundFunctionalIndexes:is_filter_needed()returnstrueunconditionally, so the column filter is installed even for tables without functional indexes.ReplicatedColumnsView: allocates astd::vector<std::unique_ptr<ColumnFilter>>for eachTable_mapevent.init_metadata_fields(): new in 8.0, adding metadata serialization work to everyTable_mapevent.
These are reasonable suspects, but I have not profiled the binlog path in isolation, so I am not claiming that they are the confirmed dominant causes.
Step 4: --db-ps-mode=auto (prepared statements)
Switching from --db-ps-mode=disable to --db-ps-mode=auto helps by avoiding full parsing on every execution. In this mode, the statement is parsed once, then re-optimized on each execution. The net effect is that prepared statements help 8.0 more than 5.7.
I have not fully decomposed why the text-protocol path in 8.0 is heavier for a simple UPDATE. It is unlikely to be the grammar itself, because a simple UPDATE does not exercise features such as CTEs or window functions. More likely, the extra cost comes from surrounding setup work in the lexer, resolver, or optimizer path. That still needs confirmation.
Step 5: innodb_flush_log_at_trx_commit=0
Setting innodb_flush_log_at_trx_commit=0 decouples transaction commit from the redo log write. This makes it easier to isolate the cost of 8.0’s lock-free redo log design.
Profiling shows that with flush=2, the function ut_delay() , the busy-wait loop inside log_write_up_to() , consumes 9.59% of total CPU in 8.0. With writer_threads=OFF, each committing thread writes to the log buffer through log_buffer_reserve(), log_buffer_write(), and log_buffer_write_completed() and then spin-waits in log_write_up_to() for the write to reach disk. This lock-free coordination machinery (log_buffer_reserve 0.57% + log_buffer_write_completed 0.33% + log_wait_for_space_in_log_recent_closed 0.31%) has no equivalent in 5.7, which uses a simpler log_sys mutex-based design.
One interesting result is that 5.7 also spends a lot of CPU in ut_delay(), in fact even more than 8.0 (13.64% vs 9.59%). But its redo path per transaction is shorter: take log_sys, write, release. So even though it spins more, it still completes more useful work per transaction.
This is a real architectural trade-off. The 8.0 redo redesign favors scalability at higher concurrency and under stricter durability requirements. But for this workload, at 8 threads and flush=2, that trade-off is unfavorable.
Step 6: Five code patches
After aligning the configuration and benchmark settings and decoupling redo with flush=0, the remaining gap is -3.1%. At this point, profiling (924K perf samples) shows a very flat CPU profile: no single function is above 1.8%. The remaining gap is spread across many small 8.0-specific overheads.
| Function | 8.0 CPU% | 5.7 CPU% | Category |
|---|---|---|---|
cmp_dtuple_rec_with_match_low |
1.18% | 0.44% | Inline Regression |
buf_flush_note_modification |
0.67% | 0% (inlined) | Inline Regression |
THD::store_cached_properties |
0.53% | 0% (not present) | New Overhead |
fold_condition |
0.43% | 0% (not present) | New Overhead |
ha_innobase::info_low |
0.36% | 0% (lighter) | Missing Fast-Path |
I group them into three categories:
- [Inline Regression]: the 8.0 version of a function grew enough that GCC no longer auto-inlines it.
- [New Overhead]: entirely new code in 8.0 that runs unconditionally, even when the feature behind it is not needed.
- [Missing Fast-Path]: 8.0 added support for more cases but did not keep a cheap fast path for the common case.
Five small targeted patches reduce the remaining gap from -3.1% to -0.2% at flush=0. The patch details are listed in the appendix.
One important note: at flush=2, these 5 patches show no measurable TPS improvement (124,572 vs 125,119 TPS). The reason is that ut_delay() in the redo commit path already consumes 9.59% of CPU and acts as a throughput ceiling. The cycles freed by the patches are mostly absorbed by extra spin iterations instead of being converted into more completed transactions.
The patches only become visible at flush=0, which confirms that they are fixing real overhead that is otherwise masked by the redo bottleneck.
4. Going deeper: how much does each factor really contribute?
After completing the step-by-step analysis, I wanted to understand the true contribution of each factor. The cumulative table above is intuitive, but it has a methodological limitation: the attribution depends on the order in which changes are applied.
For example, disabling PFS in step 2, after writer_threads=OFF but before binlog=OFF, appears to recover only 0.7 percentage points. But when I measure PFS independently, by changing only PFS from the original common baseline, the contribution is actually 2.3 percentage points. In the cumulative sequence, other costs were masking it.
So I repeated the measurements using independent ablation: each factor is changed individually from the same common baseline. That prevents one factor from hiding or amplifying another.
Common baseline: performance_schema=1, log-bin=mysql-bin, innodb_log_writer_threads=ON (8.0), --db-ps-mode=disable, innodb_flush_log_at_trx_commit=2.
| Factor changed | 5.7 TPS | 8.0 TPS | Gap | Attribution |
|---|---|---|---|---|
| Baseline (nothing) | 69,818 | 47,509 | -32.0% | — |
A. writer_threads=OFF |
69,818 | 52,539 | -24.7% | 7.2 pp |
B. performance_schema=0 |
72,316 | 50,798 | -29.7% | 2.3 pp |
C. skip-log-bin |
116,588 | 88,379 | -24.2% | 7.8 pp |
D. db-ps-mode=auto |
74,406 | 53,838 | -27.7% | 4.3 pp |
E. flush_log_at_trx_commit=0 |
81,952 | 60,906 | -25.7% | 6.3 pp |
The independent factors sum to 27.9 percentage points. Adding the code-level overhead (2.9 pp, measured at flush=0) gives 30.8 pp. The remaining 1.2 pp appears to come from interaction effects between factors. For example, binlog overhead amplifies the redo commit path, so removing both together saves slightly more than the sum of removing each in isolation.
Comparing the cumulative and independent views gives a more accurate picture:
| Factor | Cumulative | Independent | Observation |
|---|---|---|---|
writer_threads=OFF |
7.2 pp | 7.2 pp | Same, measured first, so no masking |
performance_schema=0 |
0.7 pp | 2.3 pp | PFS is undercounted 3x in the cumulative sequence |
skip-log-bin |
9.2 pp | 7.8 pp | Binlog is overcounted in the cumulative sequence |
db-ps-mode=auto |
7.1 pp | 4.3 pp | SQL layer overhead is overcounted in the cumulative sequence |
flush_log_at_trx_commit=0 |
4.7 pp | 6.3 pp | Redo overhead is undercounted in the cumulative sequence |
The main lesson is simple: if you want correct attribution, you need to control for interaction between variables. The same benchmarking principle applies to regression analysis itself.
5. Summary
The -32.0% regression on oltp_update_non_index is not caused by one dominant bottleneck. It is the result of several layers of overhead:
| Factor | Independent attribution |
|---|---|
| Binary log overhead | 7.8 pp |
innodb_log_writer_threads CPU starvation |
7.2 pp |
| Lock-free redo log architecture | 6.3 pp |
| SQL text protocol / parser path | 4.3 pp |
| Code-level overhead (5 patches) | 2.9 pp |
| Performance Schema instrumentation | 2.3 pp |
| Interaction effects | 1.2 pp |
| Total | 32.0 pp |
The largest single factor is the binary log (7.8 pp), followed closely by log writer thread CPU starvation (7.2 pp) and redo log architecture (6.3 pp). Together, these three redo/binlog-related factors account for 21.3 percentage points, roughly two-thirds of the total regression.
The code-level overhead (2.9 pp) comes from many small additions that are easy to ignore in isolation, an extra function call here, an extra pass there, but they add up. Database development is always about trade-offs. MySQL 8.0 added many useful capabilities, but on a workload running at 125,000+ queries per second, even small per-query costs accumulate quickly.
Appendix A: Patch details
Patch 1: cmp_data ALWAYS_INLINE + loop-invariant hoist
- File:
storage/innobase/rem/rem0cmp.cc - Problem: In 8.0,
cmp_data()grew past GCC’s auto-inline threshold because of added multi-value index support (is_asc,DATA_MULTI_VALUEassertions,dfield_is_multi_value()checks). The per-field comparison loop incmp_dtuple_rec_with_match_low()also redundantly callsdict_index_is_ibuf()and checksdfield_is_multi_value()on every iteration. - Fix: Mark
cmp_data()asALWAYS_INLINE. Hoistis_ibufandis_mv_indexout of the loop.
Patch 2: buf_flush_note_modification ALWAYS_INLINE
- Files:
storage/innobase/include/buf0flu.h,buf0flu.ic - Problem: Both 5.7 and 8.0 support flush observers in
buf_flush_note_modification(), but the 8.0 version grew enough that GCC no longer auto-inlines it. As a result, 8.0 emits a standalone function call on every dirty-page modification where 5.7 keeps it inlined. - Fix: Change
static inlinetostatic ALWAYS_INLINEin both the declaration and definition.
Patch 3: server_store_cached_values no-op
- File:
sql-common/net_serv.cc - Problem: 8.0 added
server_store_cached_values(), which callsTHD::store_cached_properties(RW_STATUS)on every network I/O path (packet reads, writes, async operations; 10 call sites innet_serv.cc). This refreshes cached THD properties that are rarely consumed. The mechanism does not exist in 5.7. - Fix: Replace the function body with an empty no-op.
Patch 4: fold_condition fast path
- File:
sql/sql_const_folding.cc - Problem: 8.0 introduced constant folding (
fold_condition) duringJOIN::optimize()→optimize_cond()→remove_eq_conds()on every execution, including every prepared statement re-execution. For the common shapefield OP literal_constant, which matches every sysbench query here, the function does no useful work, but still walks the full folding logic. 5.7 has no such pass. - Fix: Add an early fast path in
fold_condition()that detectsfield OP basic_constorfield OP paramand returnsfalseimmediately.
Patch 5: info_low fast path
- File:
storage/innobase/handler/ha_innodb.cc - Problem:
ha_innobase::info_low()is called by the optimizer for cost estimation on everyUPDATEandDELETE. In 8.0, the function became heavier because of additional statistics-related logic. The common case (HA_STATUS_VARIABLE | HA_STATUS_NO_LOCK) only needs a small amount of information, but still goes throughupdate_thd(),op_infowrites, and extra helper calls. - Fix: Add a fast path at the top that handles
HA_STATUS_VARIABLE | HA_STATUS_NO_LOCKdirectly and returns immediately.
Appendix B: Environment details
- CPU: AMD Ryzen Threadripper PRO 3975WX, 32 cores / 64 threads, single socket
- OS: RHEL 8.10, kernel 4.18.0-553
- Compiler: GCC 8.5.0,
-O3 -g -DNDEBUG(RelWithDebInfo) - MySQL: 5.7.44 vs 8.0.45 (KernelMaker fork)
- CPU pinning:
mysqldon cores 16–23,sysbenchon cores 24–31 (physical cores, no hyperthreading overlap) - Data: 1 table, 50M rows (
sbtest1), about 12 GB InnoDB tablespace per version - Benchmark: sysbench
oltp_update_non_index, 8 threads, 90 seconds,--report-interval=5
Shared InnoDB configuration
innodb_buffer_pool_size      = 23G
innodb_buffer_pool_instances = 4
innodb_flush_log_at_trx_commit = 2
innodb_flush_method          = O_DIRECT_NO_FSYNC
innodb_adaptive_hash_index   = OFF
innodb_io_capacity           = 10000
innodb_io_capacity_max       = 20000
innodb_page_cleaners         = 4
innodb_purge_threads         = 4
innodb_log_file_size         = 2G
innodb_log_files_in_group    = 15
innodb_log_buffer_size       = 64M
innodb_max_dirty_pages_pct   = 90
innodb_max_dirty_pages_pct_lwm = 80
sync_binlog                  = 0
8.0-only settings: innodb_dedicated_server=OFF, innodb_idle_flush_pct=1, innodb_doublewrite_pages=128, innodb_use_fdatasync=ON, default_authentication_plugin=mysql_native_password.
Non-patchable 8.0 overhead (architectural)
The following 8.0-specific CPU costs were visible in profiling, but they are not realistically patchable in the same way because they are either correctness-critical or fundamental to the current 8.0 architecture:
| Function | CPU% | Reason |
|---|---|---|
locksys::Global_shared_latch_guard |
0.84% | Lock sharding; correctness-critical for concurrent lock operations |
log_buffer_reserve |
0.57% | Lock-free redo design; replaces 5.7’s log_sys mutex |
log_buffer_write + log_buffer_write_completed |
0.67% | Lock-free redo design |
log_wait_for_space_in_log_recent_closed |
0.31% | Lock-free redo design |
PolicyMutex::enter (InnoDB trx fabric) |
1.79% | Transaction infrastructure mutexes spread across multiple internal subsystems |